
Formula: kWh = kVA × hrs × PF
A kVA to kWh calculator utilizes information about operating time and power factor to transform apparent power into real power because an estimate of the consumption of electricity (using electrical energy), considering the capacity of the apparatus/hardware measured in kilovolt-amperes, needs this conversion. Engineers, electricians, solar designers, and facility managers who need to convert system capacity into actual energy usage for planning, reporting, and verification would find it useful.
Formula & Variable Definitions
Formula:
kWh = kVA x hrs x PF
kVA: Apparent Power, total electrical load the system must supply, including real and reactive components. Found on equipment nameplates.
hrs: Operating hours, total time the equipment runs under load. Doubling runtime doubles energy consumption proportionally.
PF: Power Factor, ratio of real power(KW) to apparent power(kVA). Reflects how efficiently the system converts supply into useful output.
kWh: Energy consumed, autual energy used, the figure used for billing , fuel planning, and operational efficiency analysis.
The above formula converts kilovolts-ampere to kilowatts over the time interval. kVA is the total apparent power required by the system. This includes both the usable and the reactive. The hours measure the duration of operation under load. The power factor signifies the efficiency with which the electrical system converts supplied power
The energy consumed during operation is measured in kilowatt-hours or kWh. It is commonly used for estimating consumption from equipment rated in kVA; generator, transformer, UPS, etc.
The calculation of real energy usage uses time and efficiency, unlike kilowatt comparisons, which use simple kilovolt ampere values. This is especially relevant in operational environments when working with kva kwh relationships, where systems run for long times.
Example Calculation
A medium-sized medical establishment runs a backup power rated 18.6 kVA during routine testing. The system operates for 4.5 hours with a power factor of 0.83 due to mixed electrical loads such as lighting, diagnostic equipment, and HVAC.
Avoid
Low
Standard
Good
Ideal
Medical example: PF = 0.83
Workshop case study: PF = 0.81
Reference table: PF = 0.80 throughout
This figure enables facility managers to assess fuel consumption for backup generators, approximate operating costs, and contrast test outcomes with anticipated system functionality. It is important to convert from the capacity rating to the energy consumption the reporting.
When to Use This Calculator
When you know the equipment capacity in kVA and need the energy consumed in kilowatt-hours, this calculator is used. This is particularly useful in generator runtime planning, which is estimating the future energy consumption over a specific timeframe.
Typical PF: 0.80 – 0.92
Typical PF: 0.80 – 0.85
Typical PF: 0.90 – 0.98
Typical PF: 0.80 – 0.85
Typical PF: 0.70 – 0.82
Typical PF: 0.75 – 0.95
Engineers use this information to assess system loads, establish operating costs, and confirm trends in power use. For instance, an operating manager would know a transformer or generator’s kVA rating but would need to find the estimated electricity consumption over a full shift or operating cycle. Making use of kWh makes comparisons to previous usage data and invoices easier to verify.
| Equipment | Typical kVA Range | Est. kW (PF 0.8) | kWh per 8-hr Shift | Scale |
|---|---|---|---|---|
| 🏠 Home UPS / inverter | 1 – 3 kVA | 0.8 – 2.4 kW | 6.4 – 19.2 kWh | Small |
| 🏢 Small office UPS | 3 – 10 kVA | 2.4 – 8 kW | 19 – 64 kWh | Small |
| 🛠️ Small portable generator | 5 – 15 kVA | 4 – 12 kW | 32 – 96 kWh | Medium |
| 🏥 Medical facility backup | 15 – 30 kVA | 12 – 24 kW | 96 – 192 kWh | Medium |
| 🔌 Distribution transformer | 25 – 100 kVA | 20 – 80 kW | 160 – 640 kWh | Large |
| 🏭 Industrial generator | 50 – 500 kVA | 40 – 400 kW | 320 – 3,200 kWh | Large |
| 🖥️ Data centre UPS system | 100 – 2,000 kVA | 80 – 1,600 kW | 640 – 12,800 kWh | X-Large |
| ☀️ Solar inverter (commercial) | 5 – 100 kVA | 4 – 80 kW | 32 – 640 kWh | Medium |
Values are typical industry estimates. Always verify with manufacturer datasheets for system-specific planning.
It also assists system design and verification tasks. Energy and battery system designers frequently assess demand in relation to rated power and operational time. This determines if a system can bear the expected loads without overload
Evaluating operational efficiency is another use case. When a system is found to consume more energy than expected, then the correlation between kVA to units can assist in determining whether the fault or issue lies in the runtime, load conditions, or power factor. This helps teams to adjust their energy performance and reduce unnecessary energy usage.
Reference Table:
The more extensive table shown below illustrates a more comprehensive range of realistic kVA to kWh conversion examples using various operating times. The power factor assumption with a value of 0.8 reflects typical mixed commercial and industrial conditions.
| kVA | Hours | Power Factor | Energy (kWh) |
| 1.8 | 1.0 | 0.8 | 1.4 |
| 2.4 | 1.0 | 0.8 | 1.9 |
| 3.9 | 1.5 | 0.8 | 4.7 |
| 4.7 | 1.5 | 0.8 | 5.6 |
| 6.2 | 2.0 | 0.8 | 9.9 |
| 7.6 | 2.0 | 0.8 | 12.2 |
| 9.8 | 2.5 | 0.8 | 19.6 |
| 11.4 | 2.5 | 0.8 | 22.8 |
| 12.5 | 3.0 | 0.8 | 30.0 |
| 14.2 | 3.0 | 0.8 | 34.1 |
| 16.3 | 3.5 | 0.8 | 45.6 |
| 18.9 | 4.0 | 0.8 | 60.5 |
| 21.7 | 4.0 | 0.8 | 69.4 |
| 22.6 | 4.5 | 0.8 | 81.4 |
| 25.8 | 5.0 | 0.8 | 103.2 |
| 27.8 | 5.0 | 0.8 | 111.2 |
| 30.4 | 5.5 | 0.8 | 133.8 |
| 33.4 | 6.0 | 0.8 | 160.3 |
| 37.2 | 6.5 | 0.8 | 193.4 |
| 41.7 | 7.0 | 0.8 | 233.5 |
| 47.5 | 7.5 | 0.8 | 285.0 |
| 55.9 | 8.0 | 0.8 | 357.8 |
| 63.1 | 8.5 | 0.8 | 429.1 |
| 68.2 | 9.0 | 0.8 | 491.0 |
| 74.8 | 9.5 | 0.8 | 568.5 |
| 84.6 | 10.0 | 0.8 | 676.8 |
| 96.3 | 11.0 | 0.8 | 846.7 |
| 105.3 | 12.0 | 0.8 | 1,011.0 |
| 118.9 | 13.0 | 0.8 | 1,236.6 |
| 136.4 | 14.0 | 0.8 | 1,527.7 |
This reference will help to visualise how energy consumption increases further with longer periods of operation and higher capacity of the system. Lower entries indicate small backup systems or short runtime equipment, while higher figures indicate industrial generators, large transformers, or ongoing commercial usage.
These figures also show that kva to kwh relation shows an equal proportion. Total energy consumption doubles when the runtime doubles. If the apparent power increases, then energy consumption increases correspondingly. Thus, the table can be used as a practical planning reference that can be used to estimate energy demand from installed capacity.
Solar Products for Your Project
 Solar Panels | 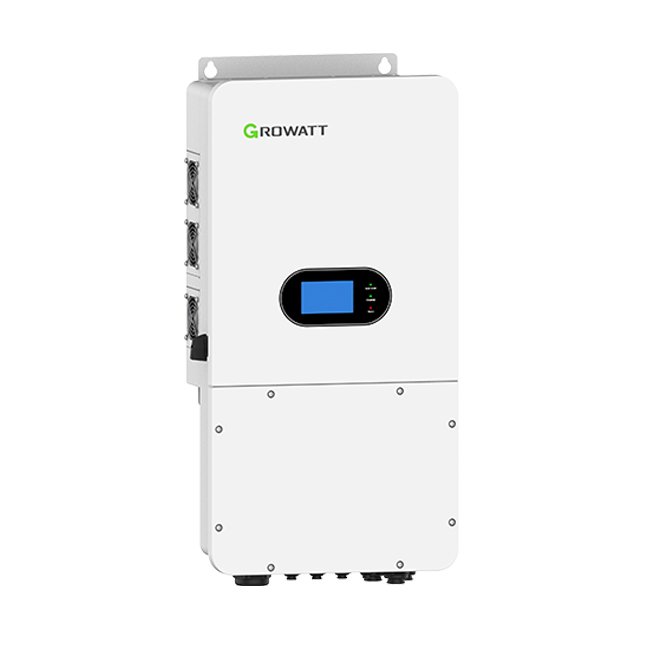 Solar Inverter |  C&I Battery Storage |
Accuracy & Limitations
The calculator operates under the assumption that the power factor remains constant and the conditions are stable throughout the designated runtime. Power factor varies practically in any system due to conditions like the type of load, equipment start-up response, etc. Energy used can be impacted by these varieties.
| Load Type | Typical PF Range | Reference PF | kWh Impact | Common Examples |
|---|---|---|---|---|
| ☀️ Resistive loads | 0.95 – 1.00 | 1.00 | Minimal loss | Heaters, incandescent bulbs, ovens |
| 💡 LED / modern lighting | 0.90 – 0.95 | 0.92 | Low loss | LED panels, fluorescent with PFC |
| 🖥️ IT / data centre | 0.85 – 0.95 | 0.90 | Low loss | Servers, switches, UPS systems |
| 🏢 Mixed commercial | 0.80 – 0.90 | 0.85 | Moderate | Offices, retail, clinics (mixed) |
| 🌡️ HVAC systems | 0.75 – 0.85 | 0.80 | Moderate | Air conditioning, chillers, fans |
| 🏗️ Industrial motors | 0.70 – 0.85 | 0.78 | Higher loss | Pumps, compressors, conveyors |
| ⚡ Welding equipment | 0.50 – 0.70 | 0.60 | Significant loss | Arc welders, spot welders |
| 🪛 Variable speed drives | 0.80 – 0.98 | 0.90 | Low loss | VFDs, inverter-driven motors |
Default tip:
When PF is unknown, use 0.80 for mixed commercial/industrial loads — the industry-standard reference value used throughout this article.
The calculations do not include loss of efficiency, inverter performance variations, wiring loss, or derating due to temperature. It is not meant to provide exact measurements but rather estimations and design calculations. For critical applications, results must be validated using actual measurements taken from the system and equipment specifications.
Case Study
A small manufacturer operates a 25.4(KVA) power generator during planned outages to keep production on schedule. The apparatus functions for 6Hrs and maintains an average power factor of 0.81.
Using a kVA to kWh calculator.
The Calculation of kWh is done as follows 25.4 × 6 × 0.81.
123.4 kWh.
The calculation revealed that the workshop would consume 123.4 kilowatt-hours during the blackout period. With this info, managers can estimate the fuel needed as well as study the performance of the generator.
Grasping the relationship between kva to kilowatt conversion and energy consumption will help the team work out the operating schedules and electricity power shortages.
Conclusion
The kVA to kWh calculator provides an easy means to get an estimate of the real energy consumption of any electrical equipment rated in apparent power. Incorporating runtime and power factor, it converts capacity ratings into useful energy data for planning, analysis, and system verification. Understanding the interplay between current, voltage, and power enables specialists to effectively manage the electrical and solar systems.
Frequently Asked Questions
kva represents total power, which includes both real and reactive components in an AC electrical system
To perform kva to kwh conversion, use the HBOWA Calculator for accurate results or use the formula which is mentioned above. Just one advice: use the power factor for accurate results.
No, not at all, because kilovolt ampere to kilowatt conversion depends on power factor and other values, because kW represents real usable power, while kVA represents the total sum of power or KVA/VA.
NO, but this particular factor shows the actual supply to the system.