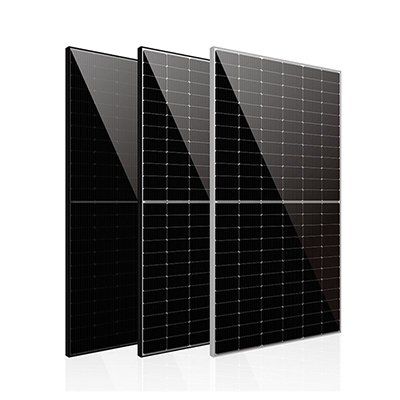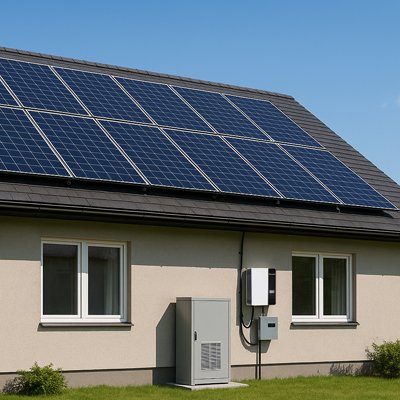
This is a first-pass estimate. Use site-specific solar data and detailed simulation for final design or investment decisions.
Introduction
To calculate the solar power generation a PV system can generate, you just need to multiply its capacity by the available solar resource and a factor representing the PV system. This gives a first estimate of energy production. The actual solar power/energy production depends on location or design, temperature, shading, soiling, equipment, and system losses.
What Do You Need to Calculate Solar Power Generation?
Solar system capacity
Solar power or solar energy calculations begin with the installed PV capacity. The rated power of a panel is typically expressed in watts (W), while bigger power systems are described in kilowatts (kW). The term “peak” refers to the rated DC capacity of the PV array under standard test conditions.
For instance, the nameplate capacity of a 20-panel system of 550 W panels is 11,000 W or 11 kWp. Essentially, the array doesn’t mean that it produces 11 kWh all the time. The capacity indicates how much power the machine can generate under the prescribed conditions. Energy indicates how much electricity is generated.
Peak-sun hours and system performance
Subsequent inputs refer to peak sun hours and realistic performance indications of the system. Peak sun hours refer to equivalent hours of solar irradiance at 1,000 W/m2 rather than the total daylight hours. This makes them useful for estimates of solar energy output from a PV array.
The performance of a system is affected by several loss mechanisms, namely inverter conversion, shading, soiling, mismatch, wiring, connections, availability, and module-related effects. The PVWatts model does not assume all PV systems possess one fixed efficiency. Instead, it treats these factors separately.
Solar Power Generation Formula
Basic formula:
A practical starting point for solar power generation calculation is:
Estimated daily generation (kWh) = PV capacity (kW) × peak sun hours × performance factor
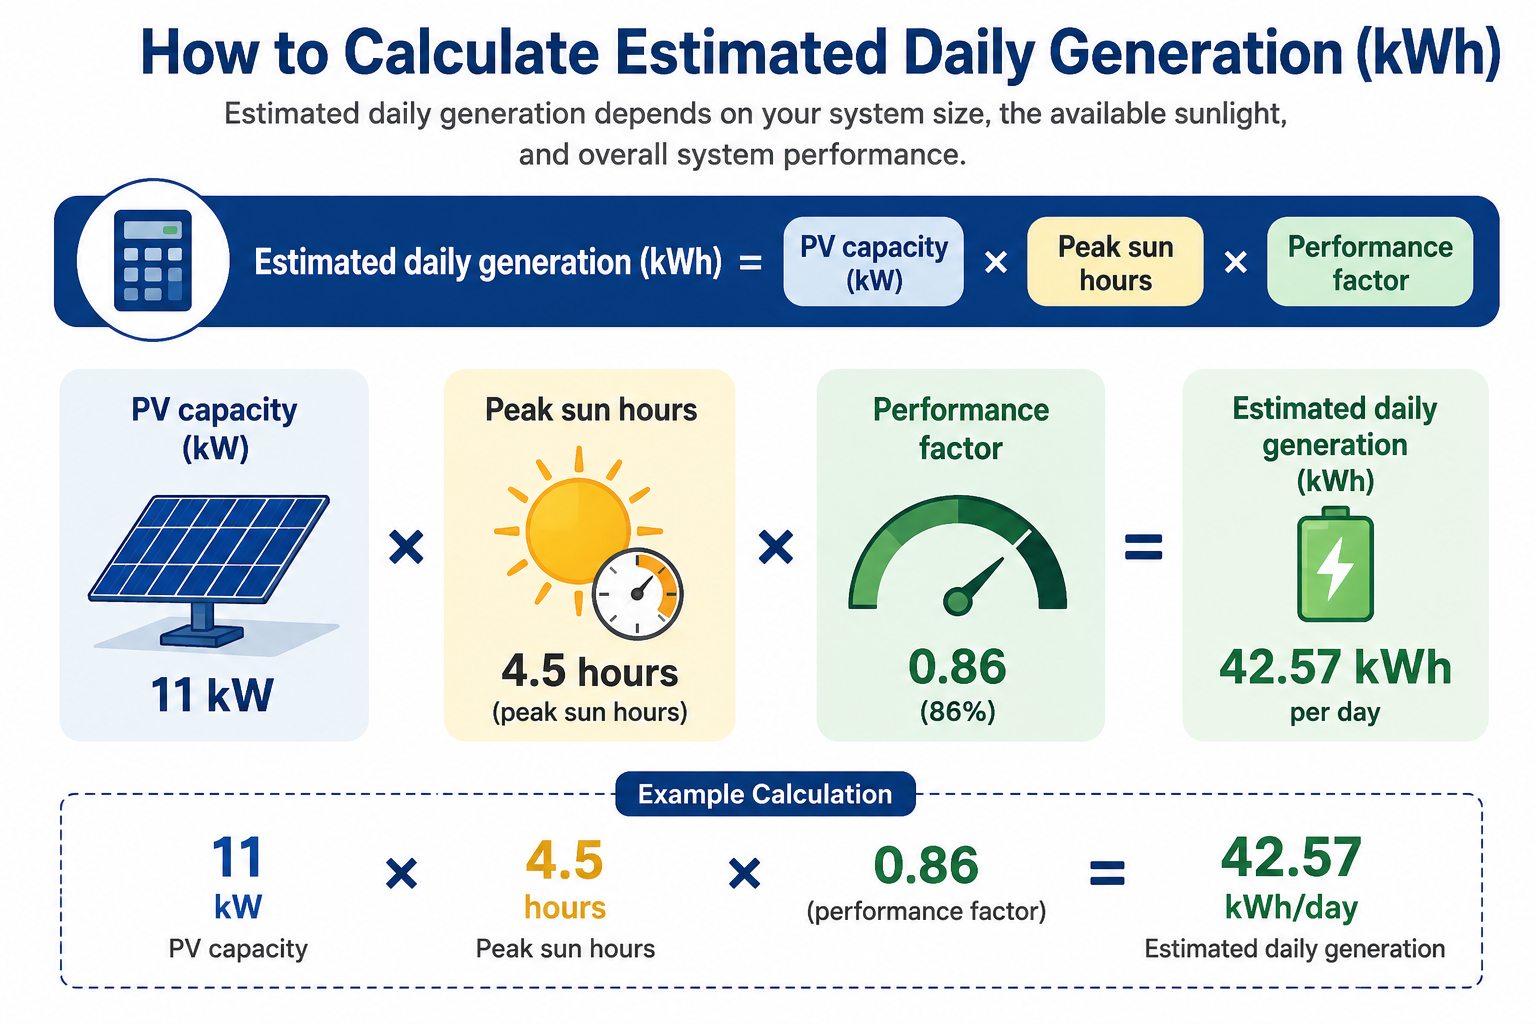
All variables are different from one another. The installed DC nameplate rating is the PV capacity. Peak sunshine hours are the same equivalent quantity of available solar resources. The performance factor is what remains of the potential production after relevant system influences.
This should be considered a first-pass estimate, not an exact production number. A basic formula will not recreate every hourly variation in operating irradiance, module temperature, shading, equipment functioning, or system availability. When estimating the output of a commercial or utility-scale installation, those factors become critical.
Annual generation using specific PV yield
For preliminary annual planning, a more location-specific approach is to use specific yield:
Annual generation (kWh/year) = Installed capacity (kWp) × specific yield (kWh/kWp/year)
Specific yield measures the quantity of electricity a PV system generates per unit of installed peak capacity. According to the Global Solar Atlas, PVOUT is reported in kWh/kWp and is characterized as the energy produced by a PV system per unit of installed peak load capacity.
This method is helpful because solar resource availability is variable by location. The Global Solar Atlas does not assume that all sites receive the same solar resource. Instead, it takes into account the solar generation and temperature models along with PV system configuration in its production simulations.
Why an 80% efficiency assumption is not universal
A common shortcut people take is to assume that a PV system operates at 80 per cent efficiency and to use that figure for every calculation. While that may work as a specifically tailored illustration, it may not be presented as a general property of solar systems.
To put things in perspective, PVWatts Version 5 documentation by NREL assumes a 14% default total system-loss assumption in its model. The figure considered various modeled losses like soiling, shading, mismatch, wiring, connections, availability, nameplate rating, and others, which were combined rather than simply added.
Thus, the appropriate performance factor is based on system and modeling assumptions. Use site-specific data and documented assumptions, if available, for a serious power generation calculation.
How to Calculate Solar Power Generation Step by Step
Step 1: Calculate the installed PV capacity
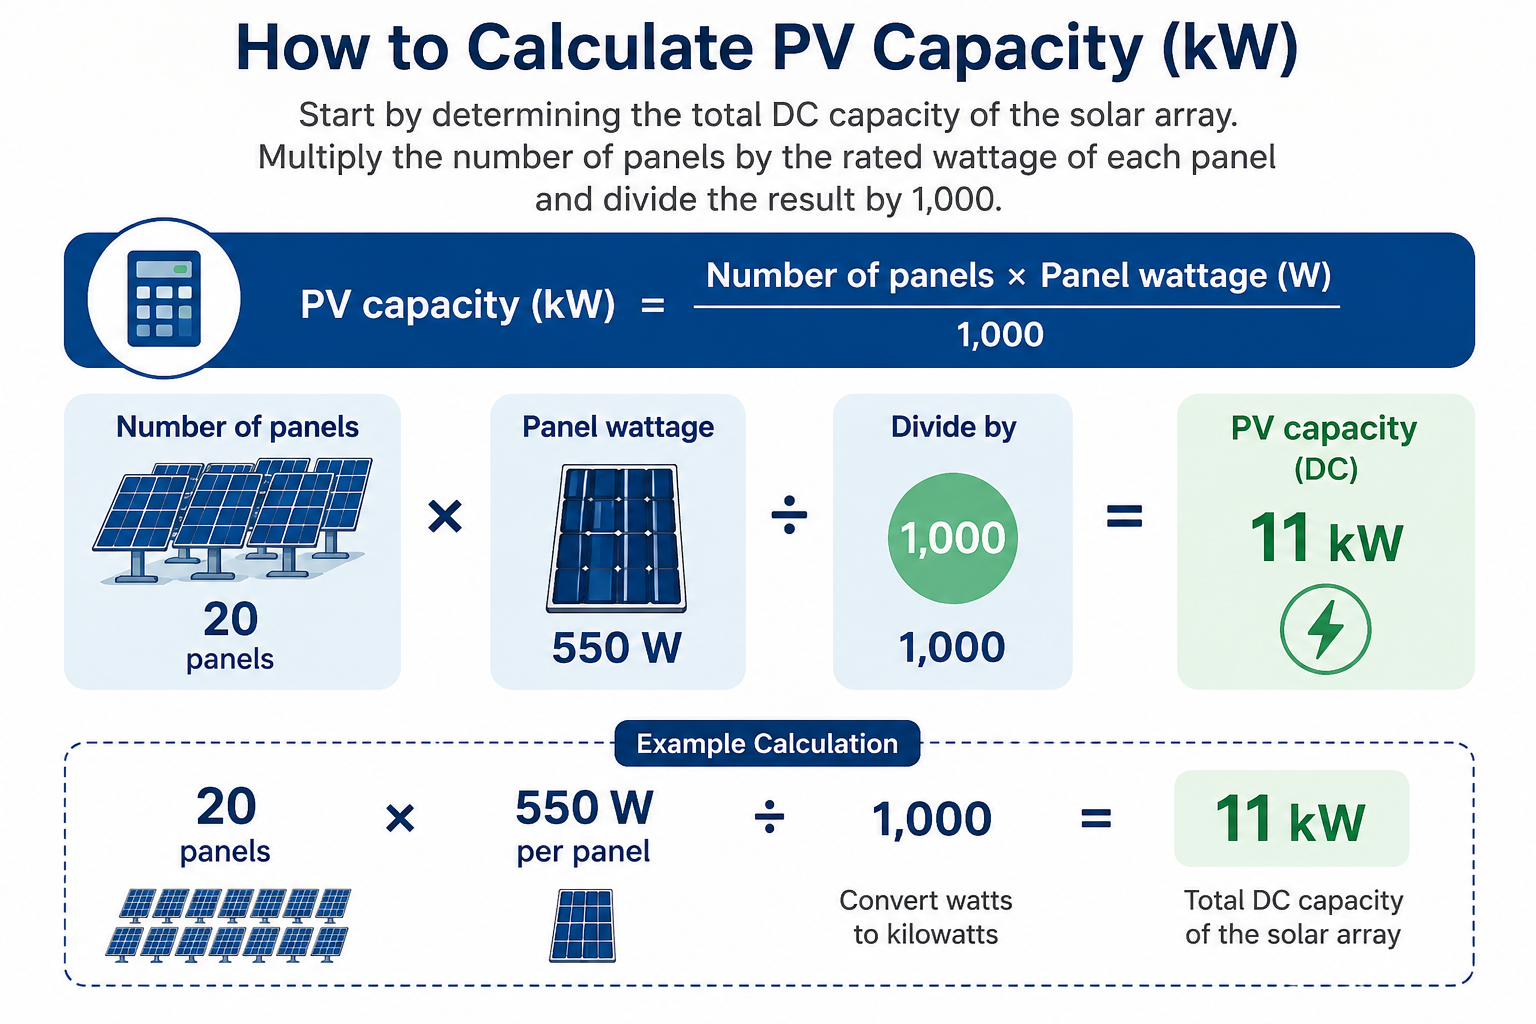
The nominal DC capacity of the array is represented by this figure. It must not be mistaken for the AC power rating of the inverter and is different from the amount of power the system will produce in a day or year.
Step 2: Determine the solar resource for the location
Next, determine the amount of usable solar power available at the installation site. An estimated number of peak sun hours can give you a quick solar power calculation. For preliminary project assessment, site-specific PV yield or PVOUT data is more robust.
PV simulation can include time-maximum variation of solar radiation and temperature for comprehensive planning. The Global Solar Atlas employs location-specific solar radiation and air-temperature data to simulate the electricity production of PV systems. Its methodology also takes into account mounting configuration, module temperature, inverter conversion, and the selected system losses.
Step 3: Account for system losses
After establishing the solar resource, apply a performance factor based on realistic system conditions. Don't pick a percentage just because it's widely quoted online.
The right assumptions are based on the installation. The performance of a commercial array that is well oriented, well ventilated, and easy to maintain will be different from one that is shaded, has high module temperatures, difficult to maintain access, or is more prone to soiling.
Step 4: Calculate daily generation
Using the illustrative 11 kW system:
11 kW × 4.5 peak sun hours × 0.86 = 42.57 kWh/day
This is an illustrative calculation only. The assumption of 4.5 peak sun hours and 0.86 performance factor is used to demonstrate the formula only, and not a production claim at any location.
Step 5: Estimate monthly and annual production
For a rough period estimate, daily output can be multiplied by the number of days:
Estimated period generation = Estimated daily generation × Number of days
Nevertheless, taking one average day multiplied by 365 can mask seasonal changes in solar resource. An improved estimate of annual solar energy output uses site-specific yearly yield:
Annual generation = PV capacity (kWp) × annual specific yield (kWh/kWp/year)
This method is especially useful for comparing the electricity yield of potential sites. The yield value reflects the solar resource and modeling conditions of the selected location, rather than assuming equal generation each day.
What Factors Affect Solar Power Generation?
The outcome of solar power calculations is fundamentally determined by the amount of energy falling on the modules and how efficiently the system converts this energy into usable electricity. The crucial factors are:
| Factor | Effect on generation |
| Solar irradiation | Determines available solar energy |
| Orientation and tilt | Changes radiation received by modules |
| Temperature | Affects module operating performance |
| Shading | Reduces usable irradiance |
| Soiling | Reduces light reaching modules |
| Inverter losses | Reduce DC-to-AC conversion |
| Wiring and mismatch | Create electrical losses |
| Availability | Production is lost during downtime |
| Degradation | Gradually affects long-term output |
Solar irradiation varies by location, season, and weather and thus affects usable resource potential. The orientation and tilt determine the extent to which the modules can receive that resource. There is no tilt angle or azimuth that has universal maximization of production. A site- or location-based PV potential is calculated by the Global Solar Atlas, which employs solar radiation data along with temperature and system configuration information.
So do the module operating conditions. When cells are heated to a high temperature, the performance of the PV is reduced. Shading and soiling limit the sunlight reaching the PV modules. The actual output of solar panels can be impacted by a number of factors.
The other factors take place within the system. The mismatch, wiring, conversion, and downtime of inverters reduce delivered electricity. NREL's PVWatts model uses separate loss categories for several of these effects and does not use a single efficiency value.
Degradation should also be included for long-term estimates. The impact is slow, which makes it more important in assessing the lifetime production than a day’s production. These factors together determine real-world PV system performance and explain differences in output from two systems with the same rating.
Worked Example: What Does the Estimated Solar Output Mean?
The sample with 11 kW in Section 4 gives an indicative estimate of 42.57 kWh/day. A more important question is what exactly that number tells you.
To begin with, 42.57 kWh refers to energy and not the instantaneous power. It indicates how much electricity would be generated over the specified day given the assumptions used. It does not imply that the PV system produces 42.57 kW constantly.
The figure also does not show how much electricity a building will actually consume. The demand of a site may sometimes be above the respective PV generation and sometimes below. Therefore, depending on the configuration and operation of the system, the energy generated can either be consumed, exported, curtailed, or stored in a battery.
A screening estimate will also be an annualized figure arrived at by a simple daily calculation. The actual production will not be equal every day; throughout the year, solar irradiation, weather, temperature, shading, soiling, and system availability vary.
Assuming a single indicative kWh/kWp daily output applies in all months year-round is less strong than a location-specific annual yield. Tools such as NREL PVWatts can estimate monthly and yearly production based on location and system assumptions.
Essentially, the assumptions behind a solar power generation calculation are critical. The calculation will only be as good as these assumptions.
Real-World Context: Why PV Generation and Battery Capacity Are Different
Solar energy generation and battery storage refer to different parts of an energy system. With regard to the rated generation capacity of the array, PV capacity is indicated in kW or kWp. The capacity measured in kW of the inverter or PCS defines power conversion capability. Battery capacity measured in kWh refers to energy stored.
Published Project Data by Pretapower Provides Useful First-Party Examples. A project in Togo combines 300 kW of PV with 400 kWh of battery storage, while a project in Poland uses a 50 kW inverter with 301 kWh of battery capacity for a commercial application.
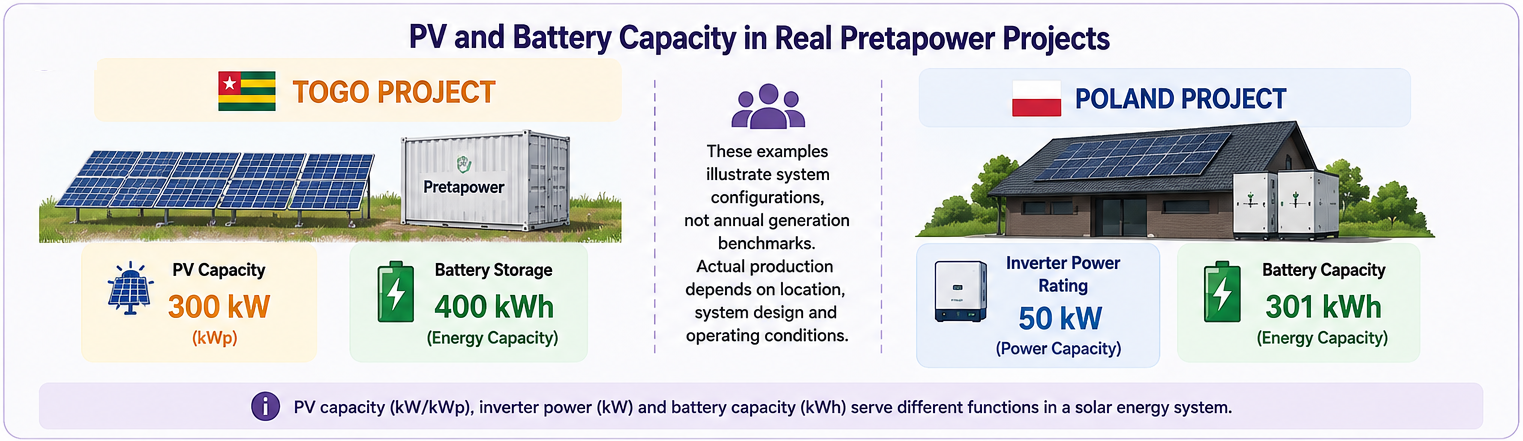
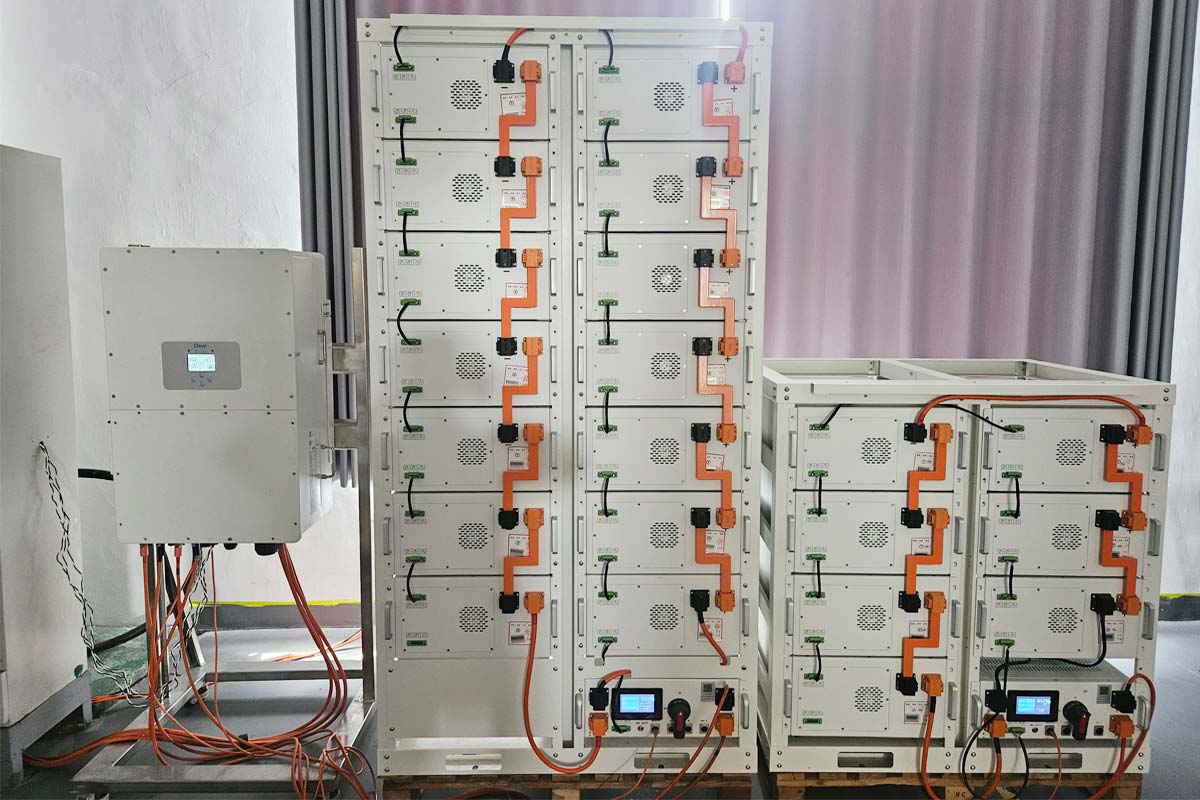
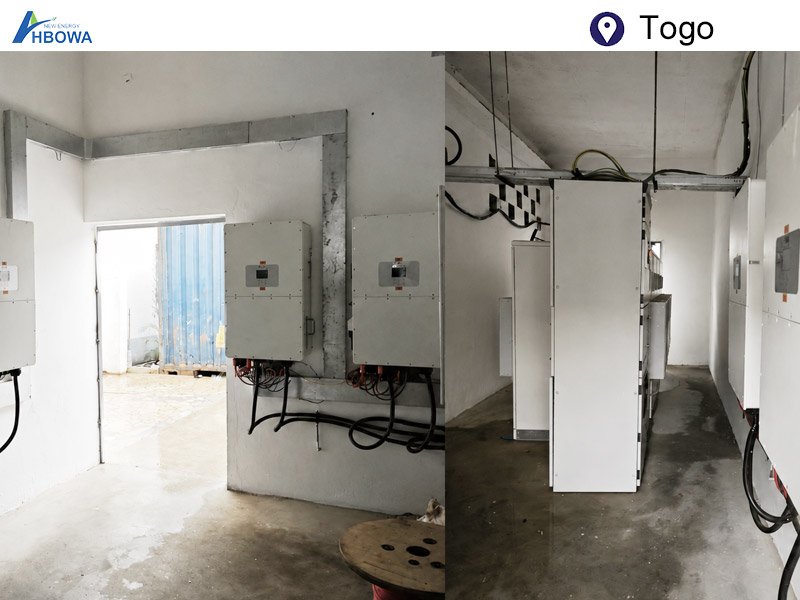
These configurations shouldn’t be considered generation standards. Battery sizing is indicative of the load at the site, operating schedule, and application. The project-design guideline issued by HBOWA considers maximum demand, operating load, peak duration, and electricity tariffs to determine storage power and capacity.
Which Solar Generation Calculation Method Should You Use?
The appropriate solar power generation calculation depends on how much accuracy you need.
| Method | Best for | Main limitation |
| Capacity × sun hours × performance factor | Quick estimate | Relies on simplified assumptions |
| kWp × specific yield | Preliminary planning | Depends on location and data quality |
| PV simulation | Project design | Requires more technical inputs |
| Monitoring data | Existing systems | Requires operating history |
A simpler formula is enough for a usability check for a few moments. Location-specific yield or detailed simulation is most suitable for investment decisions, system design, or solar power plant calculations.
NREL PVWatts enables the user to estimate electricity generation from grid-connected PV systems with configurable system-loss assumptions. Companies like HBOWA and Global Solar Atlas provide information on PVOUT at the location of interest and a PV modelling approach that takes into account the solar resource and the characteristics of the system.
To respond to increasingly large projects, engineers can therefore move from a simple estimate toward detailed modelling of solar potential for a building, leveraging the actual site, system configuration, and operating conditions.
Common Solar Power Calculation Mistakes
Solar power calculations can be misleading if inaccurate. Initially, daylight length is not equivalent to peak sun length. In addition, kW represents the power capacity, and kWh represents the energy output. One can’t be used instead of the other.
A more common mistake is applying a performance factor of 80% to all installations. The design of the system and the operating conditions affect losses. As an example, NREL’s PVWatts model utilises separate assumptions for soiling, shading, mismatch, wiring, availability, and other losses rather than treating them as a universal efficiency rate.
Solar panel output is also only one part of module efficiency. The full system can deliver less energy due to temperature, shading, soiling, or electrical losses.
Finally, the product of an average daily result and 365 should be seen as an estimate and not a forecast for the year. Solar energy varies seasonally across regions.
How Inverters and Energy Storage Affect the Final Energy Picture
In a typical solar power installation, the energy path is simple: Solar panels –> DC electricity –> inverter –> AC loads or grid. When storage is present, excess electricity has another pathway: excess solar → battery → later discharge → loads.
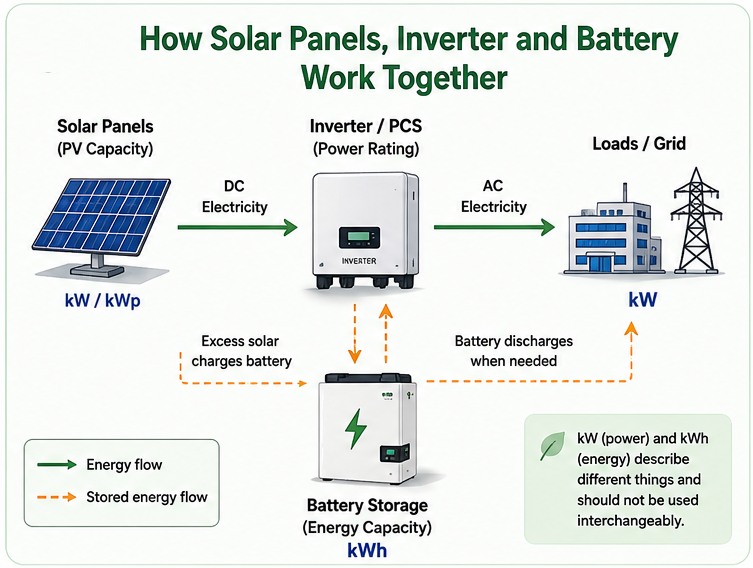
An inverter having a rating of kW can convert the specified amount of power. Battery capacity is measured in kWh, indicating the energy storage. The PV array is unaffected, as the amount of sunlight has not changed.
In this scenario, the battery can move but cannot create any additional solar generation from the electricity used. When comparing PV capacity, inverter size, and energy storage system capacity, this distinction is important.
Refer to HBOWA for solar panels, solar power systems, and energy storage system equipment selection.
Conclusion
A reliable way to estimate solar power generation is to get data from the PV capacity and the site's solar resource, and calculate how well the system can be expected to perform. Easy ways to make an initial calculation are lots of help. The better way to approximate specific values to use for planning or making investment decisions depends on the data accuracy, details, and modeling.
Frequently Asked Questions
Yes, but usually, the solar yield for a specific location is a better indication. Multiply the annual specific yield in kWh/kWp/year by the installed PV capacity to estimate the annual generation if it is available for the household PV system.
The power produced by a panel in watts is what the panel will produce in standard test conditions, not continuous real-world production. The complete PV system’s energy production depends on irradiance, module temperature, shading, soiling, snowfall, electrical losses, and other conditions.
For year-round planning, PVOUT or specific yield for the location might be more practical than simply peak sun hours for one day. PVOUT indicates what a PV system is expected to produce at a location relative to its installed capacity, while peak sun hours are more practical for a simplified calculation.
No. The capacity of the battery means the amount of energy that can be stored in it. It is expressed in kWh. It is unlike the electricity the PV array generates. The solar output depends on the solar electric potential, the time the sun is shining, and the output from the PV array, while battery operation means when some of that energy can be stored or used.
Yes. Two PV systems can have different annual solar energy output even if they have the same nameplate capacity. This is because there is different equipment and system availability. Capacity alone means the power output multiplied by the duration of sunlight received.
A simple estimate is employed for an initial feasibility assessment. For a detailed estimate, the model can be run on a computer, and the equipment sizing can be done.